Chapters (40)
- Cover Page
- Title Page
- Dedication
- Prologue A Brief History of Banting
- Part One
- Chapter 1
- Chapter 2
- Chapter 3
- Chapter 4
- Part Two
- Chapter 5
- Chapter 6
- Chapter 7
- Chapter 8
- Chapter 9
- Chapter 10
- Chapter 11
- Chapter 12
- Chapter 13
- Part Three
- Chapter 14
- Chapter 15
- Chapter 16
- Chapter 17
- Chapter 18
- Chapter 19
- Chapter 20
- Chapter 21
- Chapter 22
- Chapter 23
- Chapter 24
- Epilogue
- Notes
- Bibliography
- Acknowledgments
- Illustration Credits
- A Note About the Author
- Also by Gary Taubes
- Footnotes
- Copyright
It all sounds reasonable, but there are so many other variables, so many other possibilities—including the fact that the consumption of refined carbohydrates and sugars has also been increasing dramatically. To determine which hypothesis is most likely to be correct, it’s useful to focus on the United States, because it offers a starting point for the epidemic—between the late 1970s and mid-1980s*66 —and resonably consistent data with which to work.
The question of how much we eat, whether in a population or as an individual, is difficult to assess, but the evidence suggests that we consumed more calories on average in the 1990s than we did in the 1970s. According to NHANES, American men increased their calorie consumption from 1971 to 2000 by an average of 150 calories per day, while women increased their consumption by over 350 calories. This increase in energy intake, according to a 2004 report published by the Centers for Disease Control, was “attributable primarily to an increase in carbohydrate intake.” Though the percentage of fat in the diet decreased for both sexes, the absolute amount of dietary fat decreased only for men. On average, women ate fifty calories more fat each day in 2000 than they did in 1971, and men ate fifty calories less. The NHANES data suggest that either calories or carbohydrates could account for the increase in weight in the United States during this time; it would be difficult to implicate dietary fat.
The identical conclusion could be drawn from the evidence gathered by the U.S. Department of Agriculture and published in a report entitled Nutrient Content of the U.S. Food Supply, 1909–1997. The USDA says that the American food supply offered up thirty-three hundred calories a day per capita between 1971 and 1982. By 1993, it had climbed to thirty-eight hundred calories, and it remained at that level through 1997. This increased availability, and so perhaps consumption, of five hundred calories each day could conceivably explain the obesity epidemic. But carbohydrate consumption also turned upward after 1982. Of the five hundred additional calories available for consumption each day, 90 percent came from carbohydrates. The remaining 10 percent were from protein and fat, in descending order. Saturated fat dropped from fifty-three grams a day in 1971 to fifty in 1997.*67
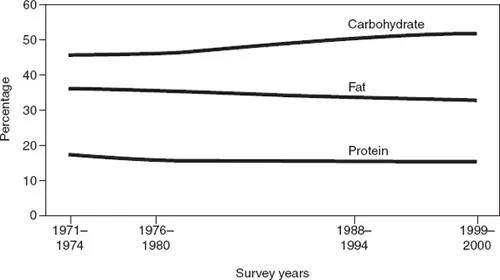
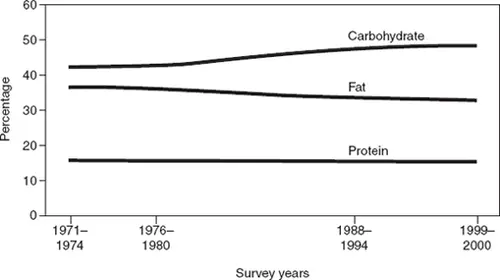
The change in calories consumed between 1971 and 2000 in women ages 20–74 years (upper chart) and in men ages 20–74 (lower chart), according to the National Health and Nutrition Examination Surveys.
In 1997, the University of Alabama nutritionist Roland Weinsier reviewed this evidence in an article entitled “Divergent Trends in Obesity and Fat Intake Patterns: The American Paradox.” “It appears that efforts to promote the use of low-calorie and low-fat food products have been highly successful,” Weinsier noted, but the reduction in fat intake did “not appear to have prevented the progression of obesity in the population.”